01
Reduce Manufacturing Lead Time
See where time is really being lost across processing, equipment queues, labour queues, batching and variability.
Find the delays. Fix the flow.

Our Solutions
Trooba Flow helps manufacturers understand what is driving lead time, queues and capacity constraints — and test improvements before changing the shop floor.
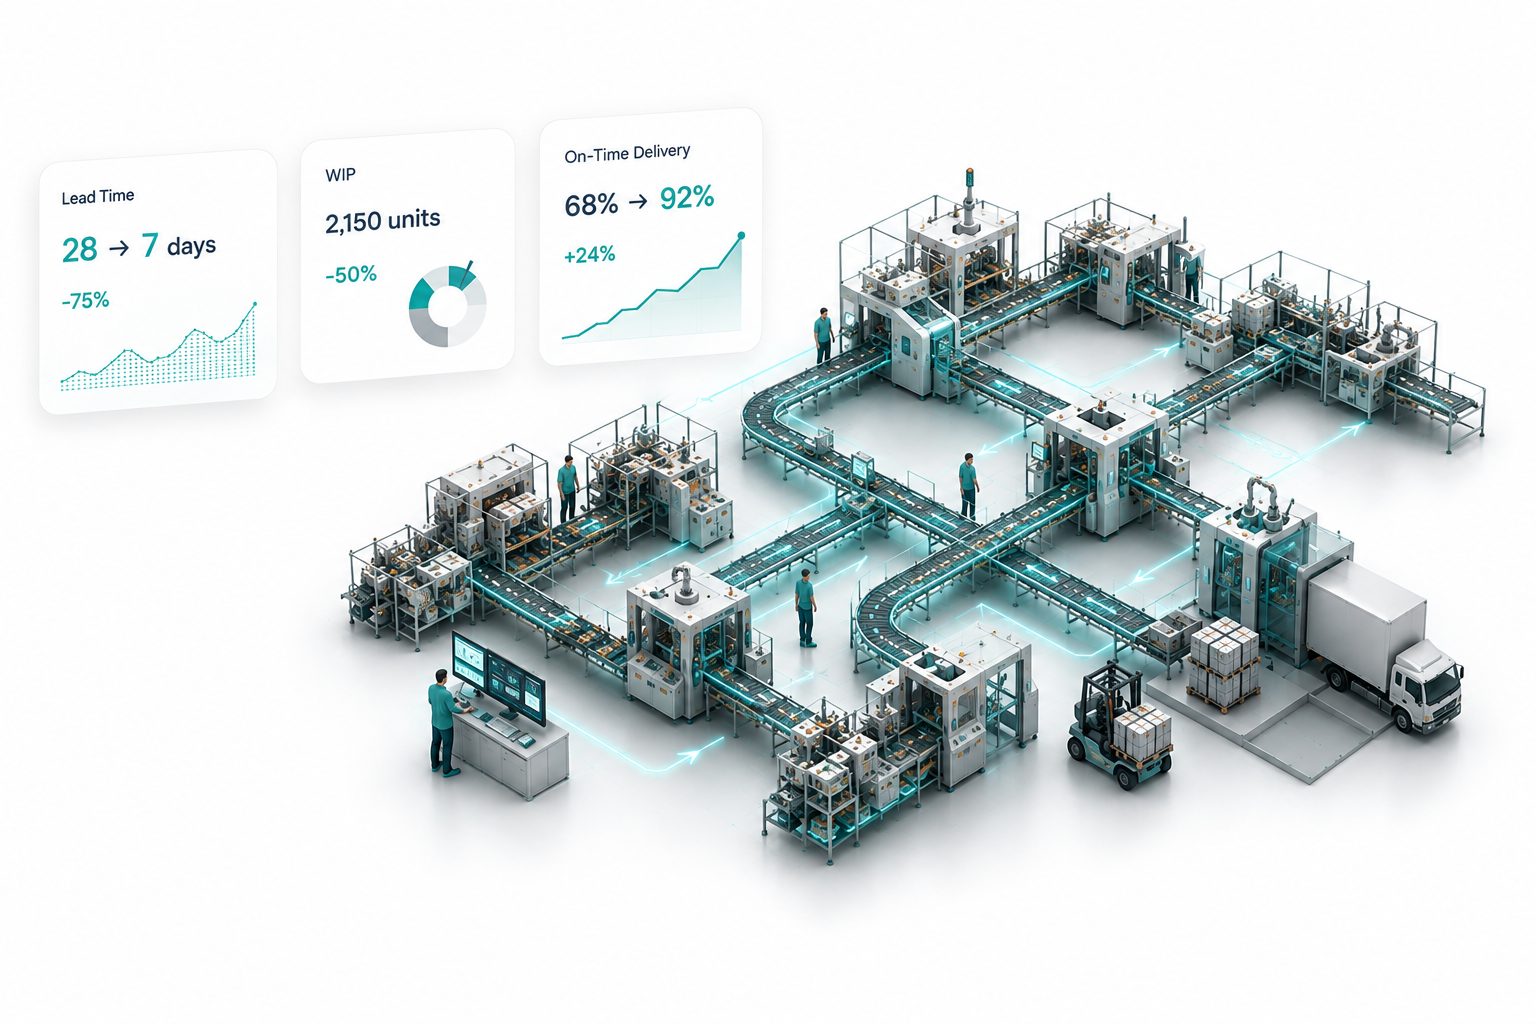
See where time is really being lost across processing, equipment queues, labour queues, batching and variability.
Find the delays. Fix the flow.
Identify the resources actually constraining production — including bottlenecks that emerge as demand and product mix change.
See the constraint before it becomes a delivery problem.
Understand where inventory is waiting, why congestion is building and which changes can improve flow.
Reduce waiting without starving production.
Determine whether you really need more machines, labour or shifts — or whether existing capacity can be unlocked through better flow.
Know when to add capacity — and when not to.
Identify the flow conditions that create delivery risk before orders become late.
Improve delivery by fixing the causes upstream.
Evaluate changes to demand, lot sizes, capacity, routings, labour, shifts and manufacturing cells before making changes on the shop floor.
Test the decision before changing the factory.
Figures throughout are from an illustrative model, not a customer result.
Understand what is happening on the shop floor.
Identify the true cause behind delays, queues and constraints.
Simulate changes and test the best options for improvement.
Quantify the expected improvement before making it real.
Trooba helps manufacturing teams make better decisions using factory-flow intelligence instead of averages, spreadsheets and intuition.