01
Understand your factory
Connect demand, routings, equipment, labour, variability, utilisation, queues and WIP into one model of how the factory actually behaves.
The AI reads the factory the way the model does.

AI Capabilities
AI that understands your factory — grounded in manufacturing physics.
Trooba Flow combines AI with queueing theory and factory-flow mathematics, so every explanation, prediction and recommendation is checked against how work actually moves.
AI proposes. The model validates.
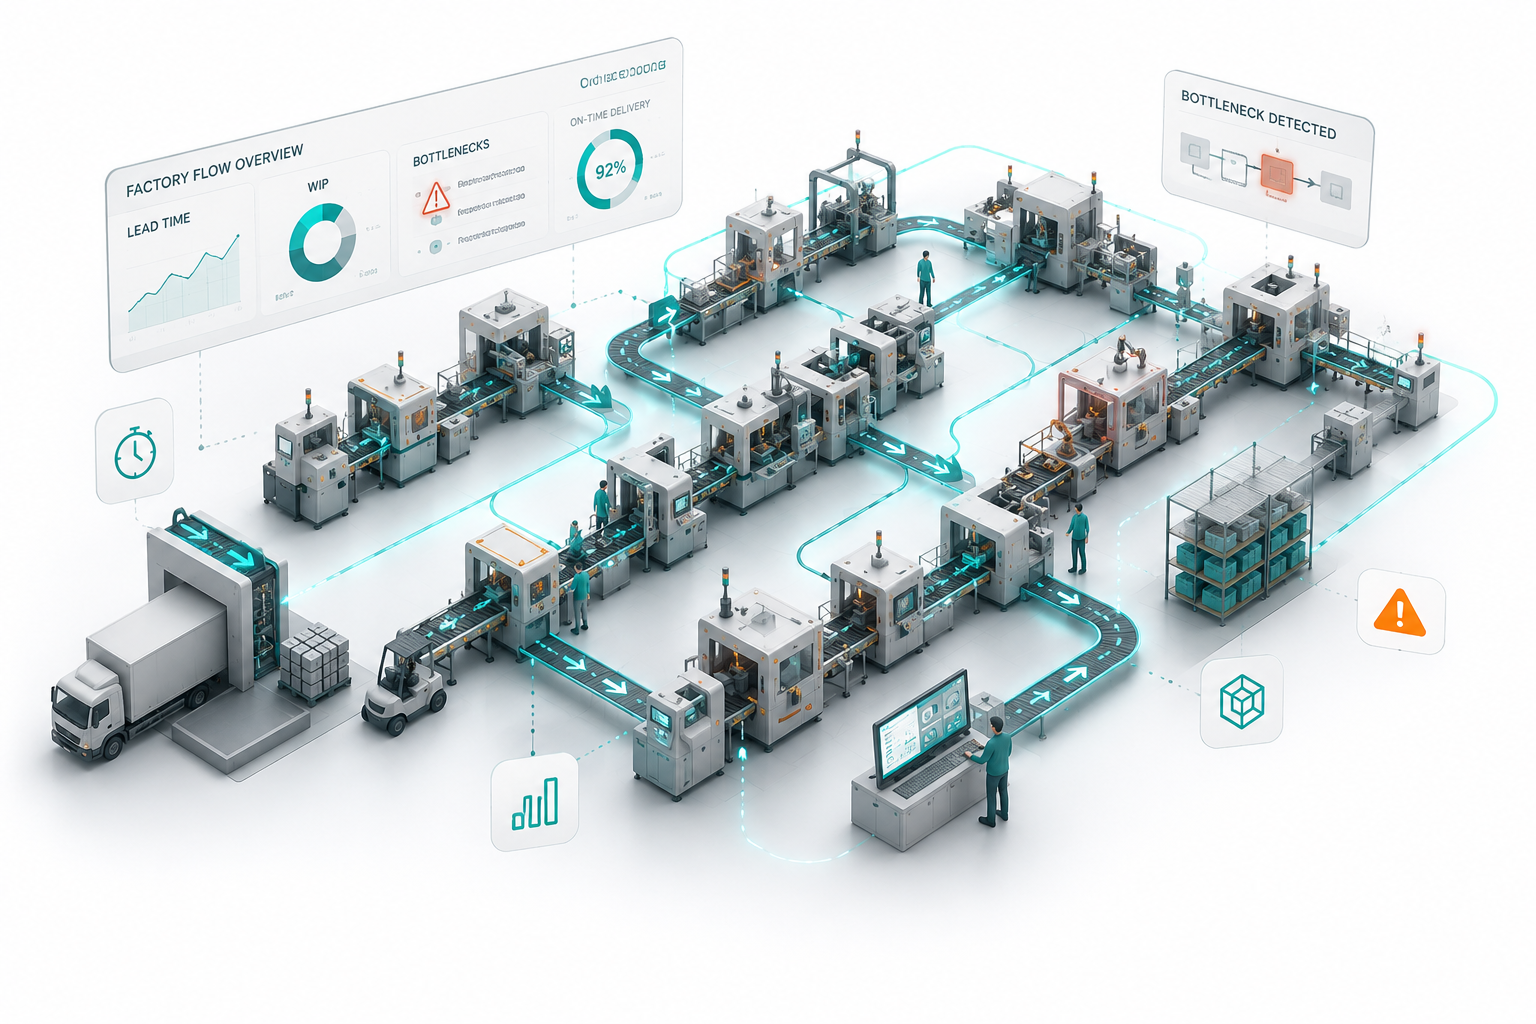
Connect demand, routings, equipment, labour, variability, utilisation, queues and WIP into one model of how the factory actually behaves.
The AI reads the factory the way the model does.
The AI answers the questions operations teams actually ask — against the model, not against a generic prompt.
Test a change in demand or mix and see where queues and constraints move before they show up on the floor.
Current demand vs +20% demand. Illustrative model.
Evaluate changes to lot sizes, capacity, routings, labour, shifts and manufacturing cells before anything moves on the shop floor.
Improvement scenario: reduce lot size
| Metric | Current state | Simulation result | Impact |
|---|---|---|---|
| Lead time | Current state 8.4 d | Simulation result 5.1 d | Impact −39% |
| WIP | Current state 1,240 | Simulation result 750 | Impact −40% |
| Queues | Current state 6.2 d | Simulation result 2.9 d | Impact −53% |
Illustrative model output. No added capacity.
More than an AI assistant
Most AI tools summarise what already happened. Trooba is grounded in a quantitative model of factory flow, so the AI can explain, predict and recommend against the same measures the plant already uses.
Complex mathematics underneath. Simple decisions on top.
WIP = TH × CT
Wq ≈ (ρ√(2(m+1))−1 / m(1 − ρ)) · ((Ca² + Cs²) / 2) · te
Share a small set of factory data and see where queues, bottlenecks and hidden capacity are affecting performance.